Data Analytics Portfolio
Transforming Data into Actionable Insights
Explore our collection of data analytics and visualization projects, showcasing how we help businesses make data-driven decisions through powerful dashboards.
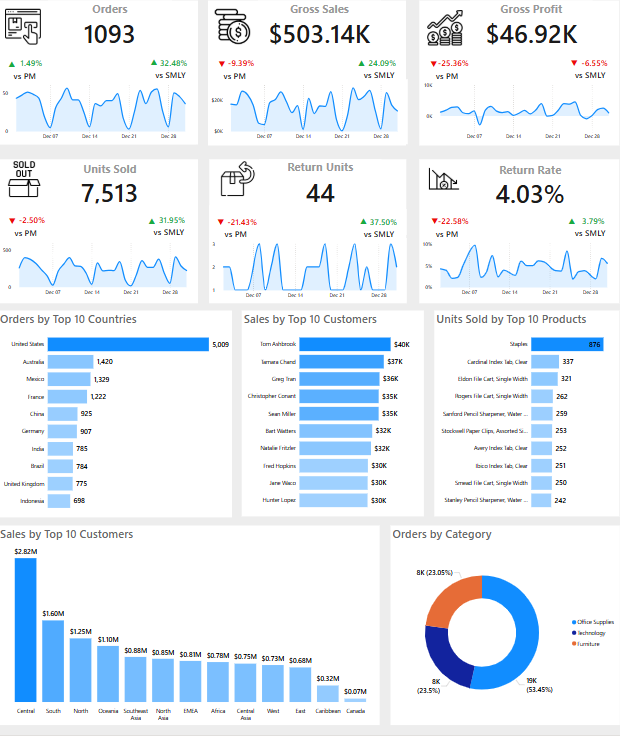
Retail Sales Analytics Dashboard
Challenge
A retail chain needed real-time insights into sales performance across multiple stores.
Solution
Created an interactive Power BI dashboard with drill-down capabilities and predictive analytics.
Outcome
20% improvement in inventory management and 15% increase in sales through data-driven decisions.
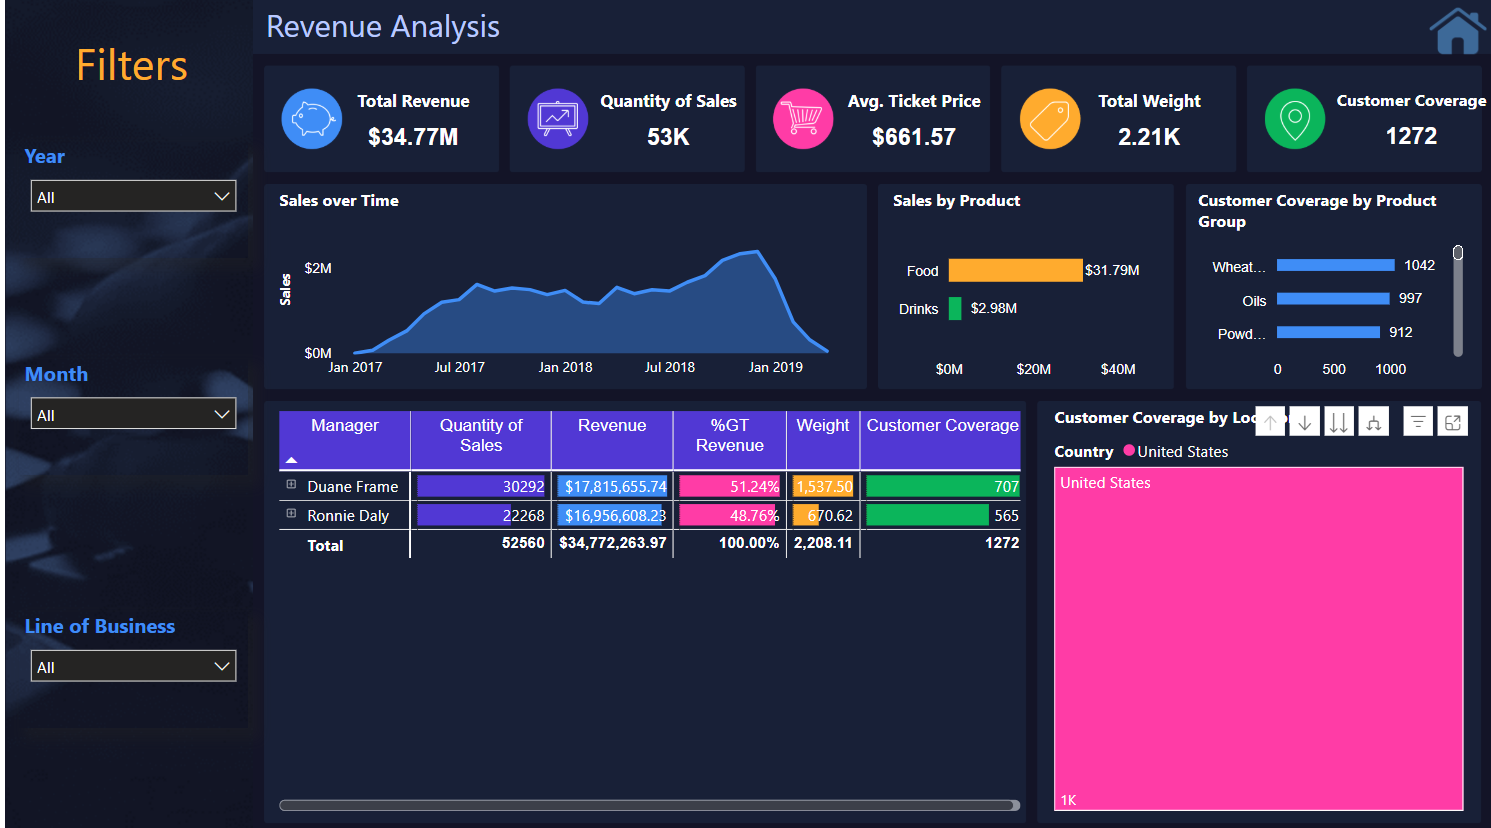
Product & Customer Insights Dashboard
Challenge
An e-commerce platform struggled to understand customer behavior and product performance.
Solution
Developed a comprehensive dashboard integrating customer segmentation and product analytics.
Outcome
30% increase in customer retention and 25% growth in average order value.

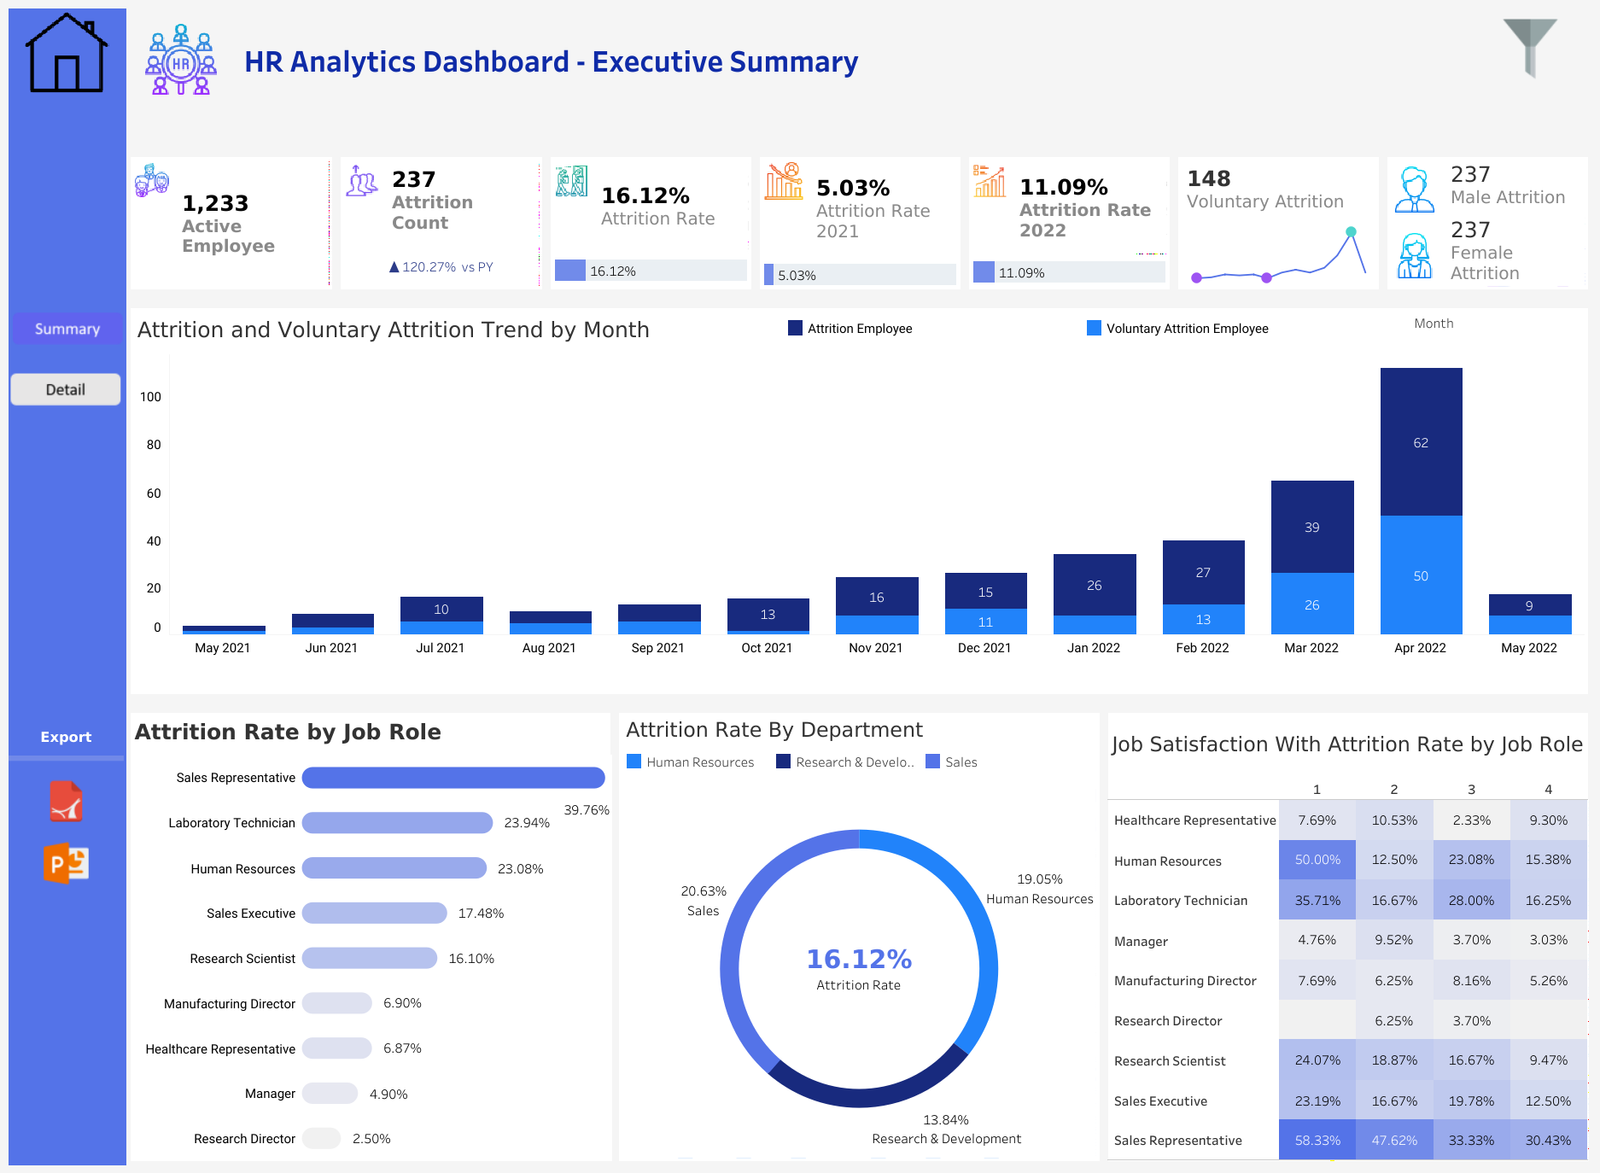
Data Analytics Project
Challenge
Client needed actionable insights from large, complex datasets.
Solution
Developed advanced analytics dashboards to visualize trends and KPIs.
Outcome
Enabled data-driven decision making and improved business performance.
Interactive Tableau Visuals Collection
Challenge
Financial institution needed better visualization of market trends and portfolio performance.
Solution
Created a suite of interactive Tableau visualizations with real-time market data integration.
Outcome
40% faster decision-making process and improved portfolio optimization strategies.
Ready to Transform Your Data?
Let's create custom dashboards that drive your business forward.